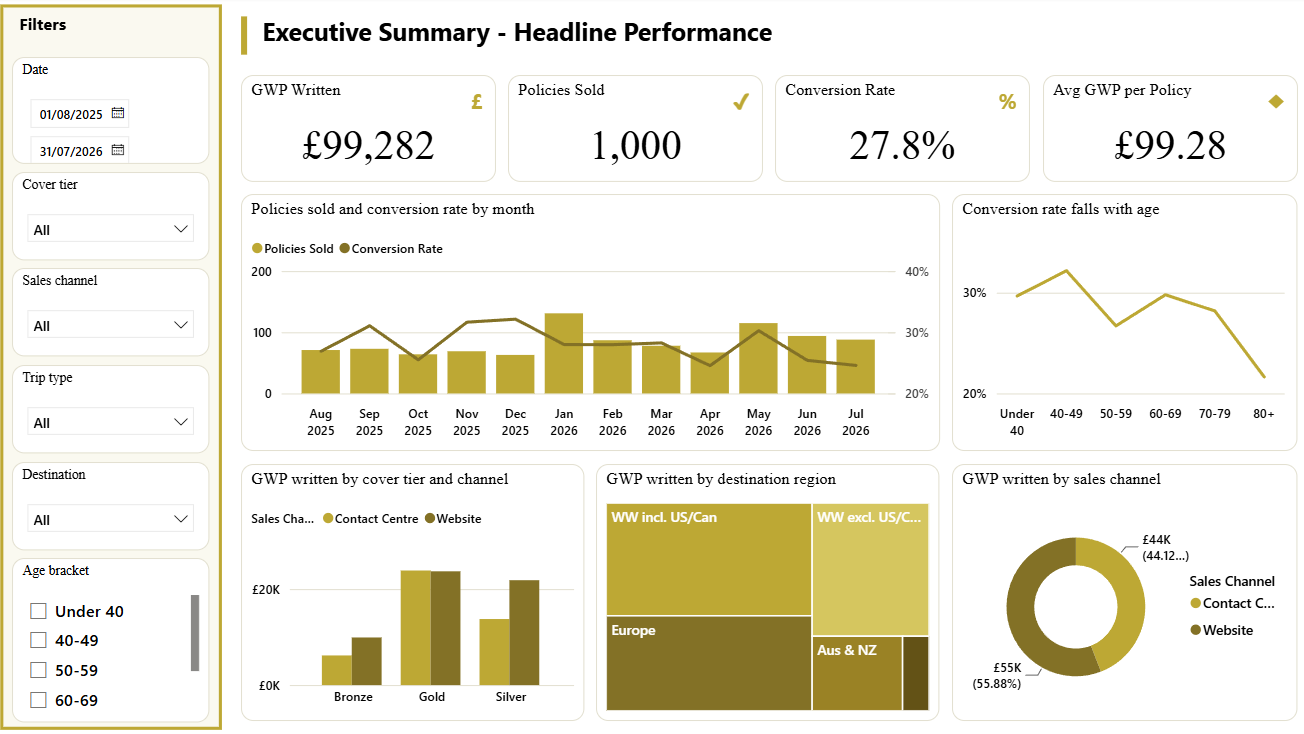
Executive summary
GWP, policies, conversion and average premium on one screen, with the monthly trend and the split by cover tier, destination and channel underneath.
KPI rowMonthly trendMix by tier
Building Power BI dashboards for teams sitting on Excel exports they can't see anything in.
Fixed price, agreed in writing before anything starts, and the finished dashboard is yours to keep.
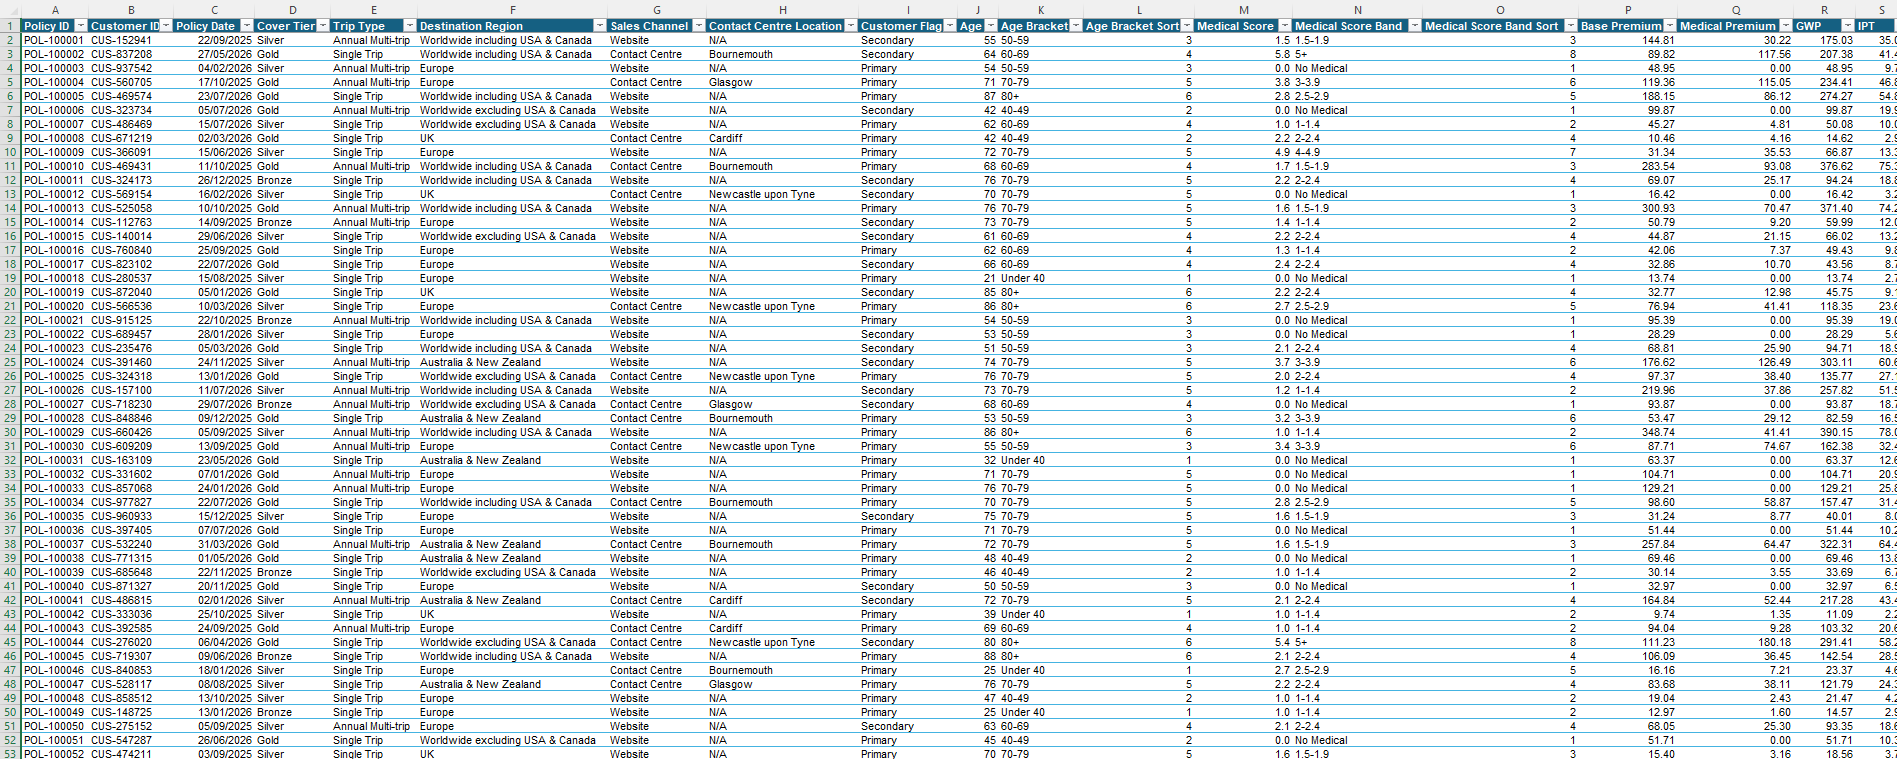
Most teams aren't short of data - they're short of a way to look at it. The month-end pack is twelve tabs deep, the figures are right, and still no one can answer "so what changed?" without an afternoon of pivot tables.
The monthly pack goes out, two people skim it, and next month it is rebuilt from scratch.
By the time the numbers explain a dip, the quarter has already closed.
One analyst, one fragile workbook. They take leave and the reporting stops.
What you get
Starting from the decisions you actually need to make, then working backwards into the model. You end up with something your directors open on a Monday morning, not another file in the shared drive.
Your existing spreadsheets and exports, exactly as they come - merged cells, inconsistent headers, months that don't line up, one workbook per entity. Getting that into shape is part of the build, not an obstacle to it.
An overview for the board, then drill-downs for the people who have to act on it - whatever your business actually runs on.
Every build ships with an in-dashboard guide, so the team can use it - and change it - without coming back. Complete Builds add an analytics deck on top, where AI-assisted analysis is agreed.
Point it at next month's Excel export and it updates. No rebuilding, no re-cutting, no "can you just re-run it for October".
How it works
A conversation about what you're trying to see and what you already have. No deck, no pitch.
A fixed price and a page list in writing before anything starts. You know exactly what lands.
Modelling the data and building the pages, with a check-in along the way so nothing drifts.
Track record
Multi-page dashboards delivered for an insurance group's commercial team, presented to company directors and the CFO, with an analytics deck alongside them.
Book an intro call to talk it through, or look at what's on offer first.
Services & pricing
Every engagement is quoted as a flat price against an agreed page list, so the cost is known before anything starts. These are the standard prices, not estimates. What varies is scope, and scope is settled in writing before any work begins.
The diagnostic step, before anything is built
One source, the essentials done properly
The full multi-page build
For groups running several similar businesses
Added after a build, never sold on its own
The two builds assume the page list is already settled. The Assessment is the step that settles it.
It is diagnostic rather than delivery - no dashboard is produced. What you get is a written recommendation: what your current reporting does and does not answer, the pages a dashboard should have and the order they belong in, and which parts of your data need restructuring before any build can work. That last point is where it earns its fee. A data problem found at this stage costs a conversation. The same problem found halfway through a build costs time on both sides.
Take it if the shape of the job isn't clear yet, or if you want a considered second opinion before committing to a build. Skip it if you already know what you need - both builds include their own scoping conversation, and the Assessment is not a gate you have to pass through.
The fee is credited in full against a build that follows, so if you go ahead it costs nothing.
Most of the work in a dashboard is not the pages. It is the modelling underneath - reconciling sources, structuring tables, writing the measures everything else depends on. That happens once, whatever sits on top of it.
So each build includes a set number of pages, and further pages are added at a fixed rate that is well below the effective rate of the pages already included. The base covers the modelling; the increment covers the page.
On the Complete Build, the seven included pages work out at £486 each. The eighth, ninth and tenth are £275. A ten-page build comes to £4,225 - about £422 a page. The more you build on the same model, the less each page costs.
The guide page sits outside all of this. It ships with every build, it is not charged for, and it does not use up one of your pages.
The same logic drives the rollout pricing. A second company on an existing model is genuinely quicker to deliver than the first, so it is priced lower - and lower again after that.
Prices exclude Power BI licensing, which is paid to Microsoft directly and is typically around £8 per user per month.
That is what the intro call is for - it will be clear by the end of it which of these makes sense, if any.
Demo
Two complete builds, shown in full rather than as a highlight reel. One for a travel insurer, one for a mortgage advisory - different businesses asking different questions, with the same approach underneath.
Built on synthetic data - every figure shown is invented
Build one
Six pages covering the whole book: what was written, what was lost, how the premium is built, and how medical risk drives both.
GWP, policies, conversion and average premium on one screen, with the monthly trend and the split by cover tier, destination and channel underneath.
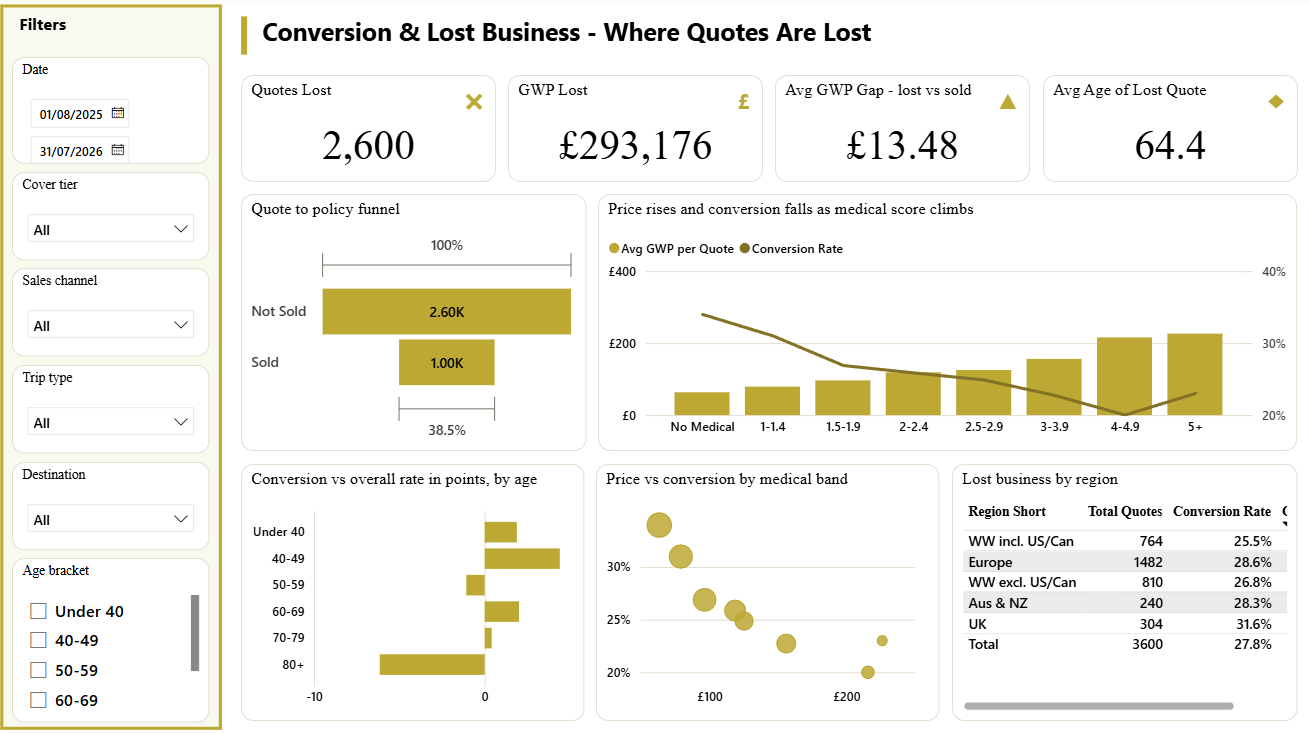
Where quotes are lost: the quote-to-policy funnel, how price and conversion move as medical score climbs, and which regions leak the most business.
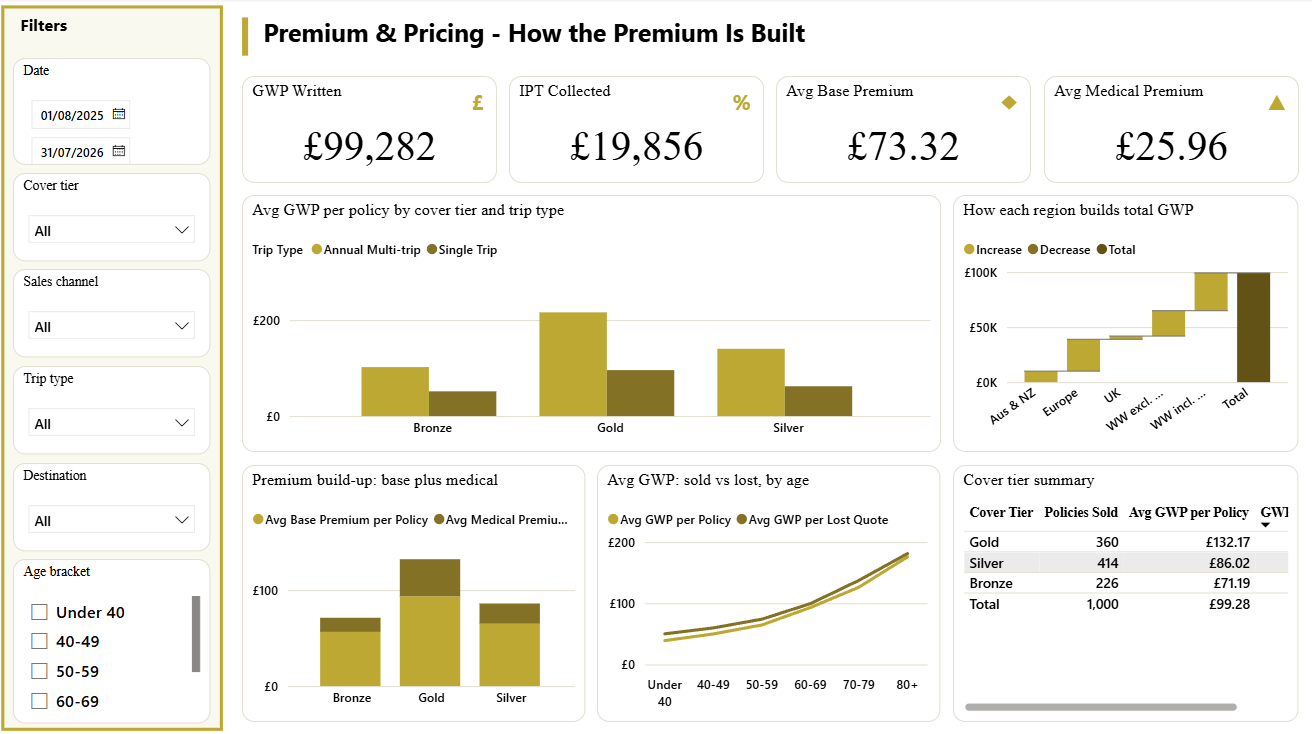
How the premium is actually built - base against medical loading, by cover tier and trip type, with a waterfall showing each region's contribution to total GWP.
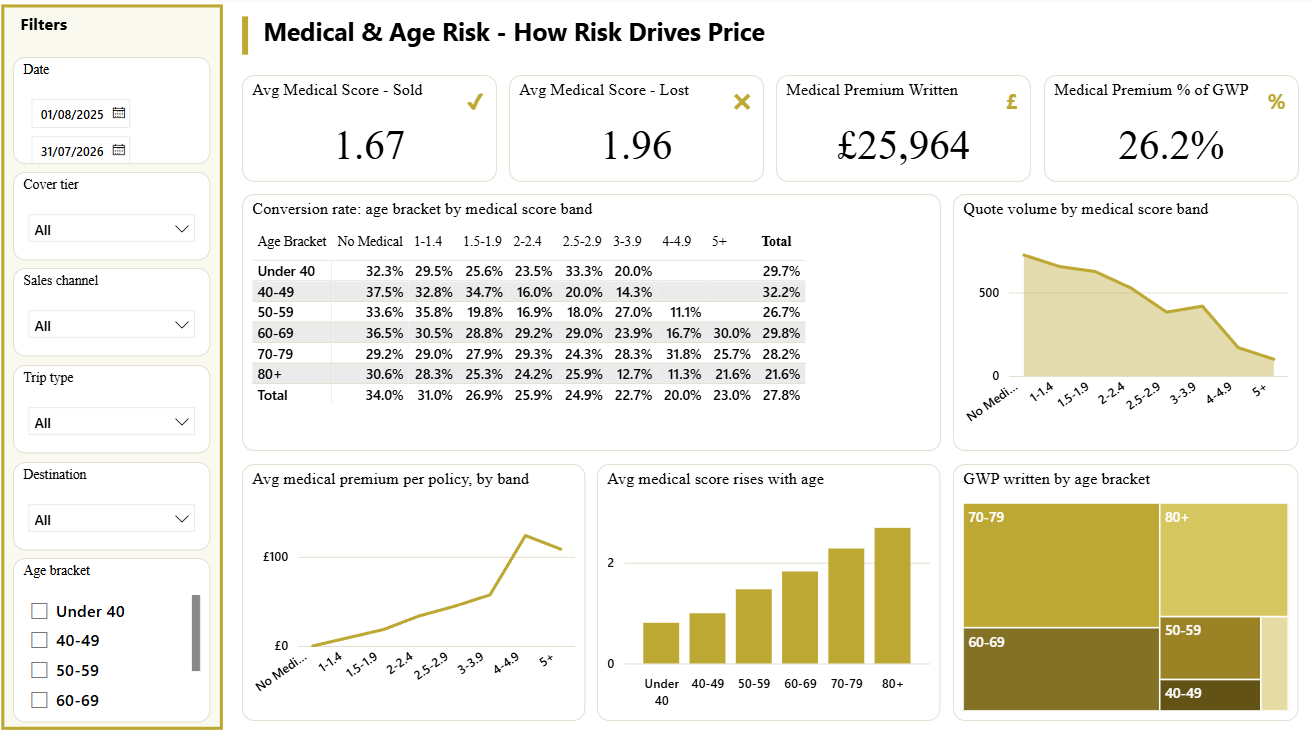
Conversion by age bracket against medical score band as a matrix, plus how the average score and the medical premium both climb with age.
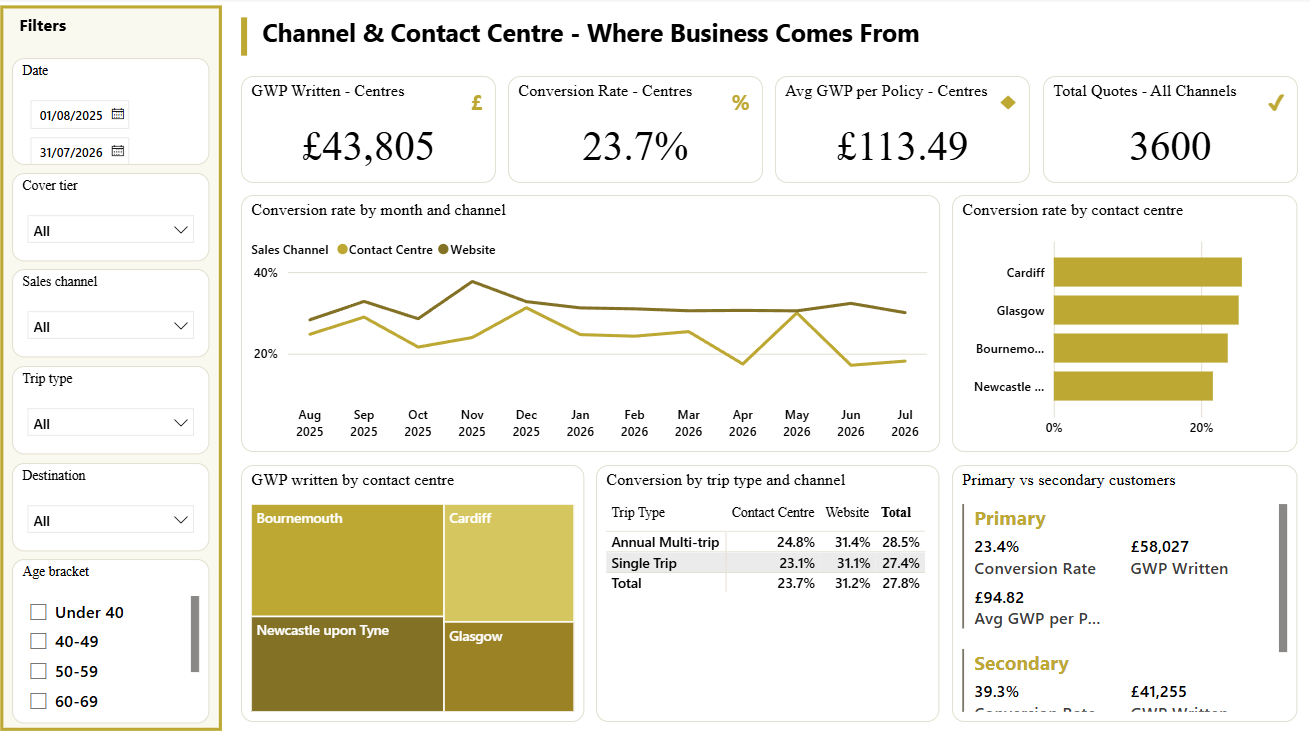
Where business comes from: conversion by month and channel, performance by individual contact centre, and primary against secondary customers.
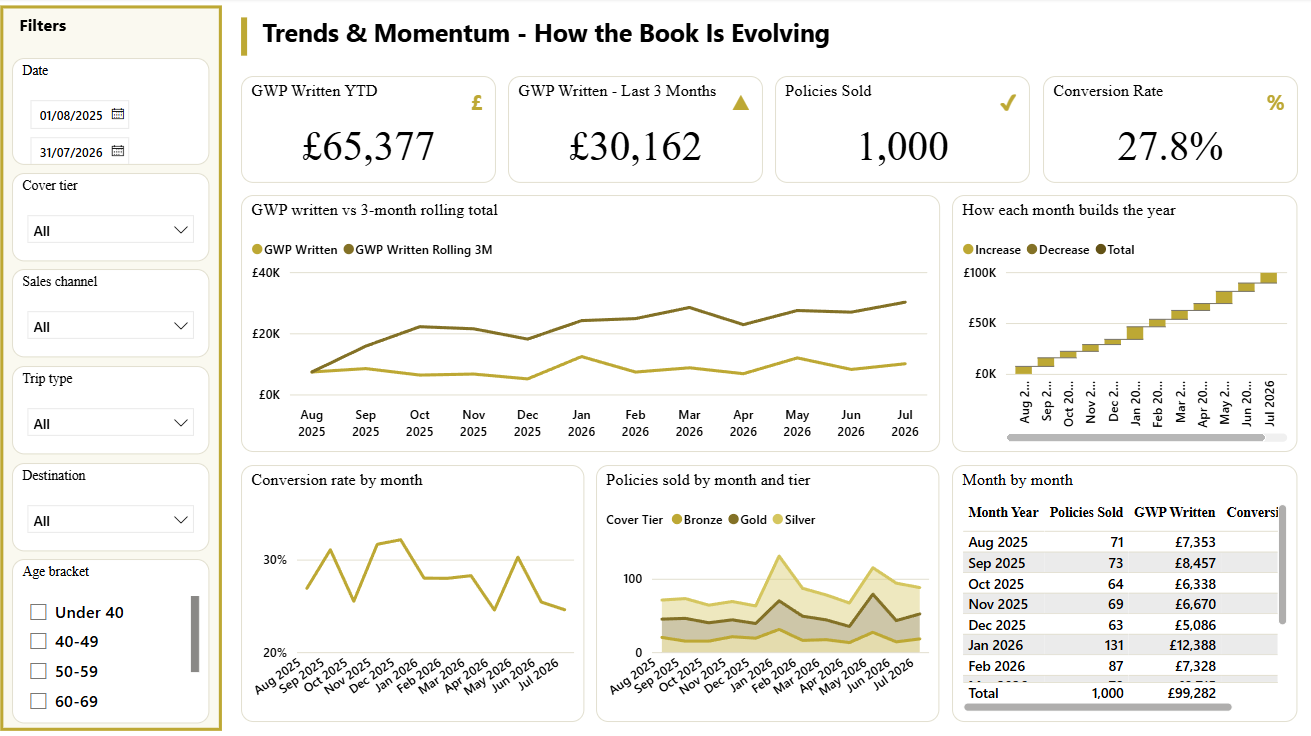
How the book is evolving - GWP against a three-month rolling total, the monthly build to the year, and policies sold by tier over time.
Build two
Six pages following a case from enquiry to completion, then asking which advisers, lenders and lead sources actually pay for themselves.
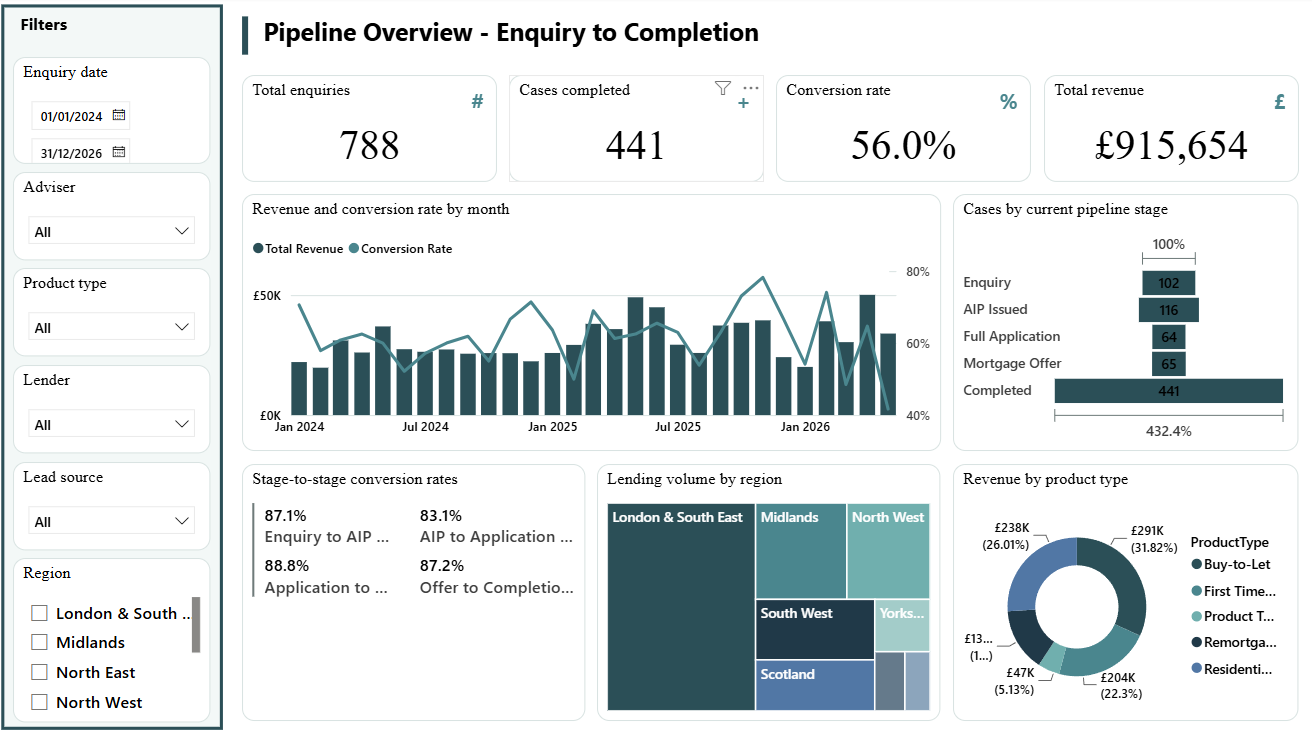
Enquiry through to completion: the stage funnel, stage-to-stage conversion rates, lending volume by region and revenue split by product type.
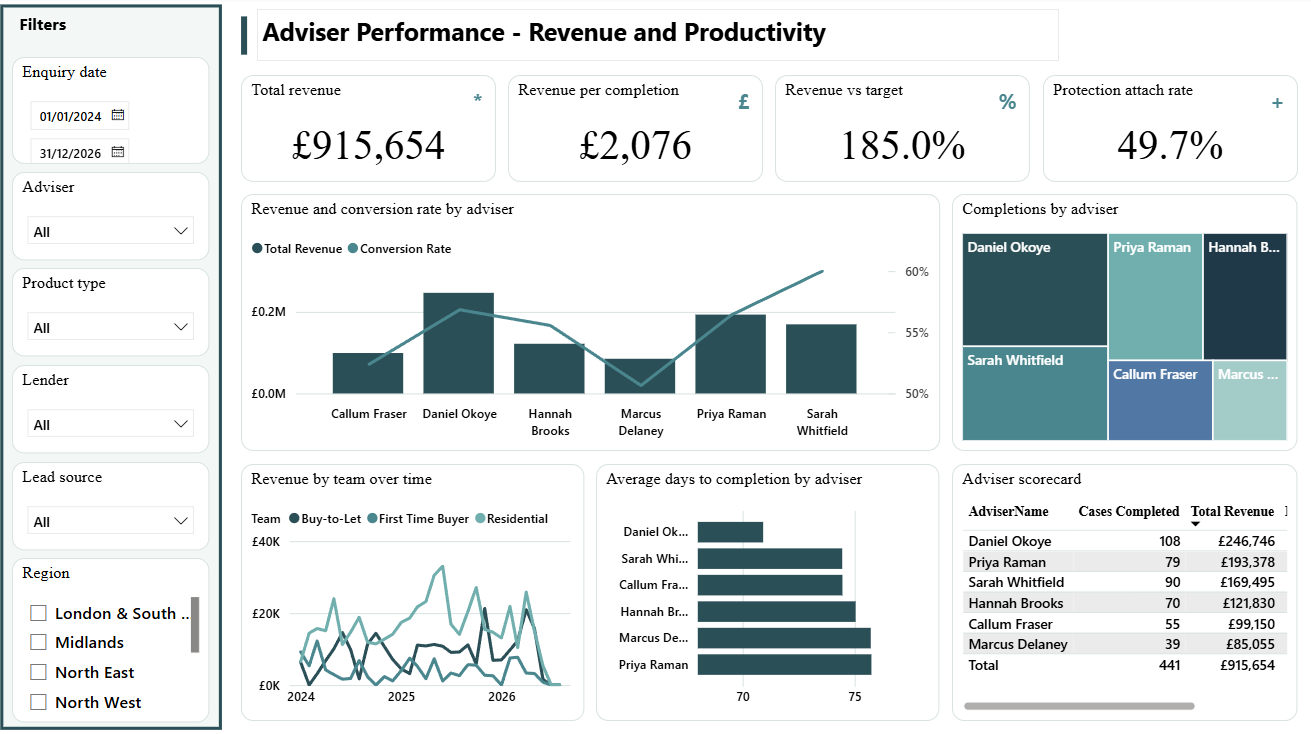
Revenue and conversion rate per adviser side by side, completions by adviser, average days to completion and a full scorecard.
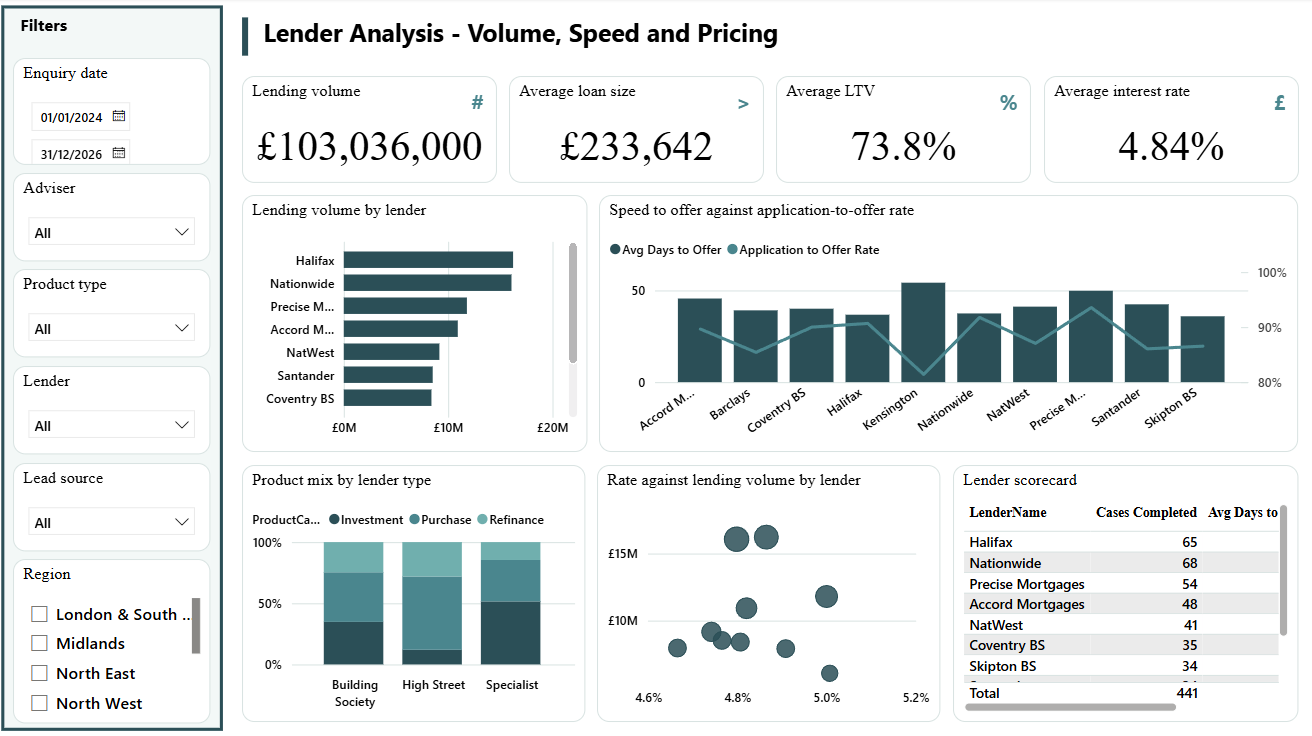
Volume, speed and pricing by lender - lending volume, speed to offer against application-to-offer rate, product mix by lender type and rate against volume.
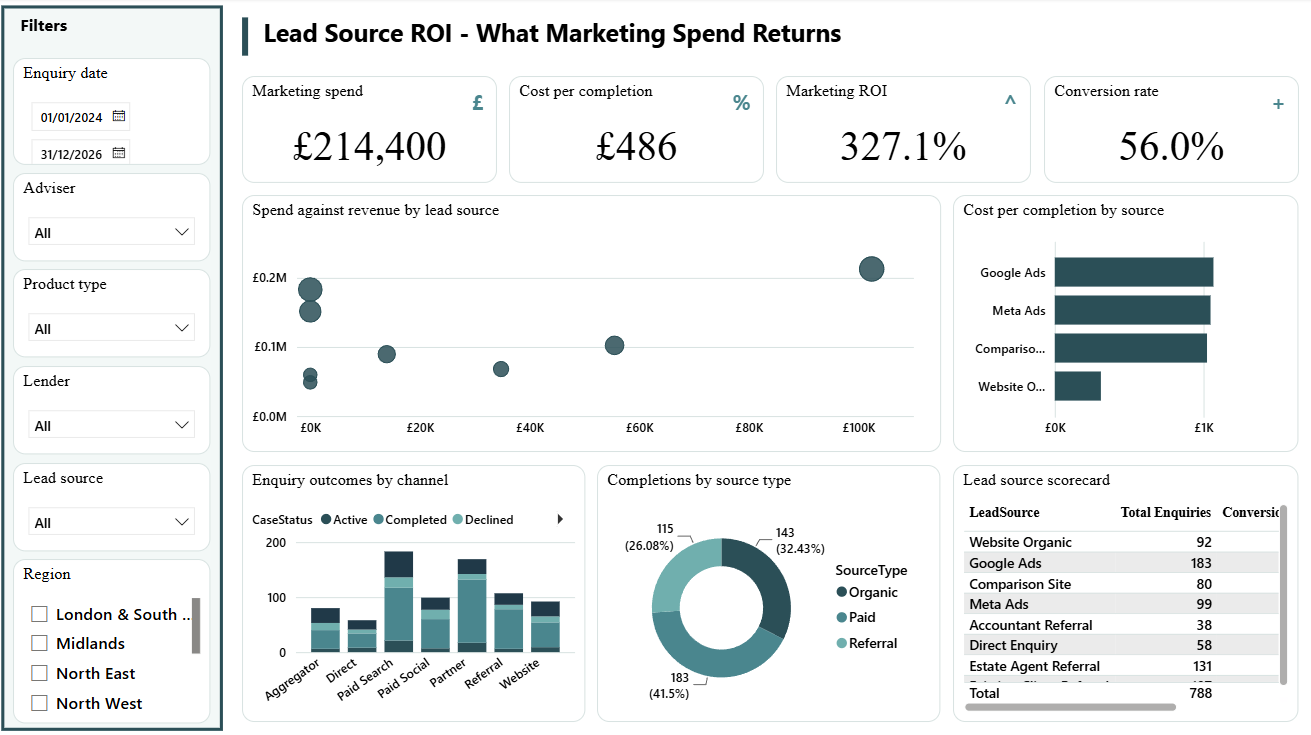
What marketing spend returns: spend against revenue by source, cost per completion, enquiry outcomes by channel and completions by source type.
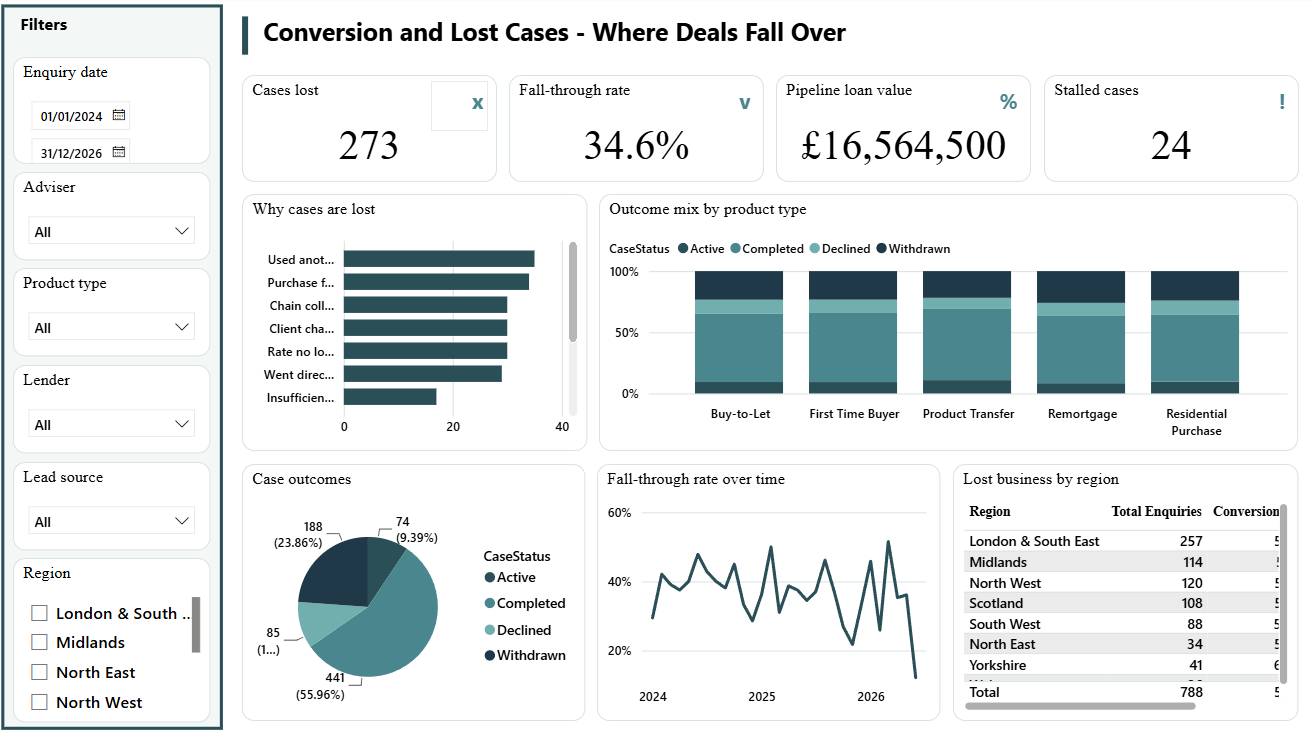
Where deals fall over - the reasons cases are lost, outcome mix by product type, fall-through rate over time and lost business by region.
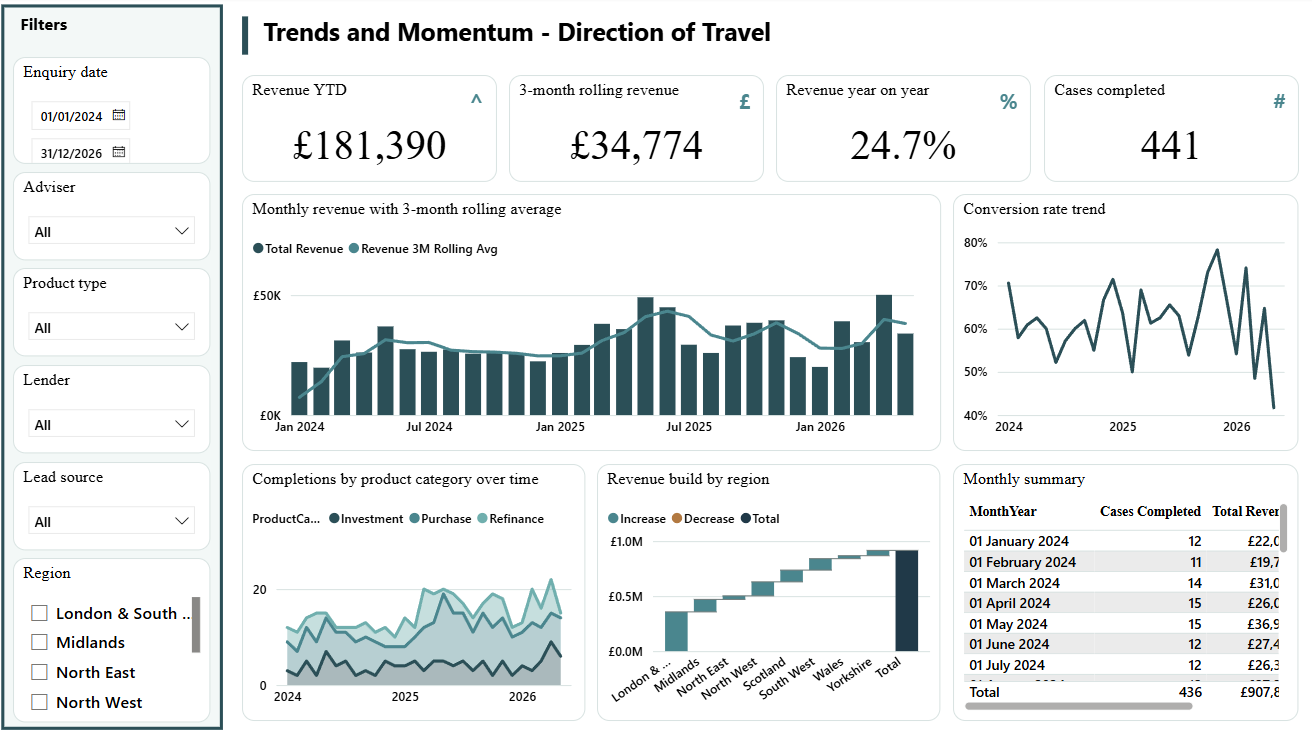
Direction of travel: monthly revenue with a three-month rolling average, the conversion trend, completions by product category and revenue build by region.
Case study
An insurance group's commercial team had two years of data for one of its portfolio companies sitting in Excel, and no visual reporting over it at all. There was no template to follow and no fixed expectation of what the output should be.
A multi-page dashboard covering:
The team asked for the same thing for a second company in the group. Because the model already existed, the second build came together far more quickly: restructure the source files to match, repoint the directory, re-run. That pattern is now a service in its own right.
Both dashboards were presented to the respective company directors and adjusted within an hour to fit their requests, then presented to the CFO alongside an analytics deck comparing the two companies' numbers and flagging the variances worth investigating.
Book an intro call, or look at what's on offer first.
About
The Visual Data Lab started with an open brief inside a commercial finance team: two years of data, and a question about what could actually be done with it.
What came out of it was a multi-page dashboard - a guide page, an executive overview, and then a page each for conversion, risk and medical, channel and marketing, team performance, trend recognition and commission analysis. It landed well enough that a second dashboard followed for another company in the same group.
Both were presented to the respective company directors, adjusted within an hour to fit their requests, and then presented to the CFO alongside an analytics deck comparing the two companies' numbers and flagging what was worth looking into.
The part that stuck was not the dashboards. It was watching people who had lived in those spreadsheets for years spot things in about ten seconds that the spreadsheets had been hiding the whole time. That is the job, and it is why this exists.
Teams in mid-size businesses that already hold the data but have no visual layer over it, and no in-house BI team to build one.
It works best where the reporting still lives in Excel: a monthly pack rebuilt by hand, one workbook per entity, and a set of questions that take half a day to answer when they should take seconds.
An intro call will settle it quickly - including if the honest answer is no.
FAQs
The things worth knowing before a first conversation.
Because none of those track the actual work. A tidy export can be quicker to model than a messy one with merged cells and three header rows. Pricing on scope means there is no penalty for having a lot of data, and no incentive to pad the job out.
Almost always. Power BI compresses data heavily on import, so a large export usually becomes a much smaller model once it is structured properly. Slowdowns come from unnecessary columns and flat, wide sheets rather than from the file itself. Restructuring that is part of the build.
Excel files. Whatever comes out of your systems today - one workbook or several, one entity or a group of them. No system access or IT project is needed to get started.
A delivery window is agreed in writing before work starts, and availability is flagged up front rather than discovered halfway through.
You do. The file transfers to you on final payment, along with the documentation. There is no lock-in and no licence to keep paying for.
It is used only to build your dashboard, never reused elsewhere, and deleted once the project closes unless monthly support is in place. If you agree, an AI assistant helps analyse the figures, but only after everything that identifies a person has been removed, and with model training switched off. You can say no. That is written into the engagement terms rather than left implied.
AI is part of how every build is made - it is a tool in the workshop, and everything it produces is checked by me before it reaches you. What you decide is whether it ever sees your actual figures, and that is a box you tick when you accept the scope document rather than something you have to argue for.
If the answer is no, the build runs on synthetic data: invented figures carrying your exact column names and structure. The model, the pages and the measures are all built and tested against that stand-in. You get the Power BI file at handover, point it at your real export in place of the stand-in, and it refreshes onto your own numbers - same pages, same measures. We do that first refresh together rather than by email, and anything that does not behave as the scope describes I put right at no charge. Your data stays with you throughout.
The one thing that route cannot include is the analytics deck, because its findings are read off the real figures. It is not built, and the price does not change either way - the deck is thrown in free with a Complete Build, so declining costs you nothing.
Half up front to book the slot, half on delivery. Revisions beyond the included rounds are quoted and agreed before any further work happens.
Bring it to an intro call - there is no charge and no obligation either way.
Contact
The fastest start is an intro call. If writing first is easier, the form below comes straight through - a sentence or two about your data is plenty.
No charge, no deck. You will leave knowing whether this is worth building at all - including if the answer is no.
Book Free Intro CallOpens in a new tab. 30 minutes, no preparation needed.
Neither is required - they just make the first call more useful.
One month of your Excel file is plenty. It says more in thirty seconds than a long description can.
The things you currently can't answer without a morning of pivot tables.
Privacy
What this site collects, why, how long it is kept and how to have it removed. Last updated 19 August 2026.
This site is run by James Rowland, trading as The Visual Data Lab, a sole trader based in the United Kingdom. For anything in this notice, including requests to see or delete your data, contact james@thevisualdatalab.com.
There is no analytics, no advertising pixel, no tracking of any kind, and nothing is stored on your device. That is why you have not been asked to accept anything. Pages are plain files - visiting the site collects nothing about you at all.
Only when you choose to get in touch. Nothing is gathered in the background.
You will not be added to a mailing list, and nothing you send is used for marketing.
A small number of service providers, each acting only on instruction:
Some of these are based outside the UK, so your data may be transferred internationally. Each operates under standard contractual clauses or an equivalent safeguard. Your data is never sold, and never shared with anyone else without your permission.
Where a build involves files containing personal data, you remain the data controller and The Visual Data Lab acts as your processor. That data is used only to build your dashboard, never reused for anyone else, never shown in a portfolio or demonstration without written permission, and never passed to a subcontractor. Personal data from your files never goes into any AI tool. An AI assistant is used as a working tool on every build, and with your agreement it also analyses your figures, after everything that identifies a person has been removed. You can decline that at no extra cost, in which case the build runs on synthetic data carrying only your column names and the analytics deck is not produced. Written terms covering this form part of every engagement.
You can ask for a copy of what is held about you, ask for it to be corrected or deleted, object to it being held, or ask for it to be restricted or transferred. Email james@thevisualdatalab.com and it will be actioned within one month, usually within a few days.
If you are unhappy with how a request is handled, you can complain to the Information Commissioner's Office at ico.org.uk.
If this notice changes, the date at the top changes with it. There is no archive of previous versions - the current one is always the one that applies.